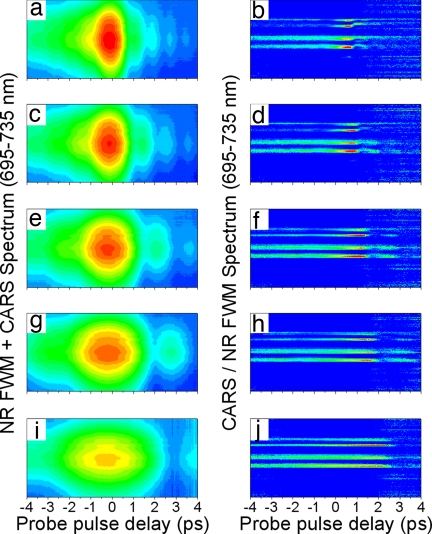
Fig. 5.
The experimentally obtained CARS spectrograms (Left) and processed CARS-vs.-FWM profiles (Right) acquired with a pellet of B. subtilis spores for different FWHM spectral bandwidths of the probe pulse Δω3: 40 cm−1 (a and b), 30 cm−1 (c and d), 20 cm−1 (e and f), 15 cm−1 (g and h), and 10 cm−1 (i and j). The integration time is 1 s. The central wavelengths of the pump, Stokes, and probe pulses are 1.28 μm, 1.62 μm, and 805 nm, respectively. The energy of the probe pulse is kept constant while the spectral bandwidth is adjusted.

