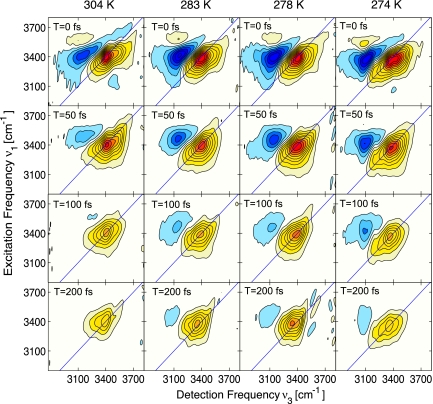
Fig. 1.
Absorptive components of the 2D IR echo spectra of pure liquid H2O for various population times and temperatures, arranged vertically for population times 0, 50, 100, and 200 fs, and horizontally for temperatures of 304, 283, 278, and 274 K. The plots for each set of temperatures are normalized to the peak amplitude of the v0–1 transition at T = 0 fs. Contour lines correspond to 10% changes in amplitude.

