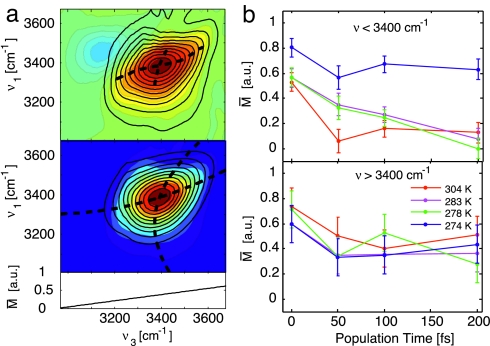
Fig. 5.
Interpretation of the correlation spectrum. (a) Eccentricity analysis of the 2D IR spectra for T = 50 fs at 283 K. (Upper) The 2D spectrum (colored contours) is fit with a double Gaussian along slices of v3 to compensate for the interference with the excited state absorption that is opposite in sign. This negative-going peak is subtracted from the data (black contours), and the peaklines are found along v3 and v1 (dashed lines). (Lower) Reconstructed 2D spectrum (black contours) using a second-order polynomial fit of the peaklines (dashed lines). From fitting and comparing multiple datasets, the error is estimated to be 11%. (b) Wavelength-dependent eccentricity as a function of population time averaged over the red side of the spectrum, v3 < 3,400 cm−1, and over the blue side for v3 > 3,400 cm−1.

