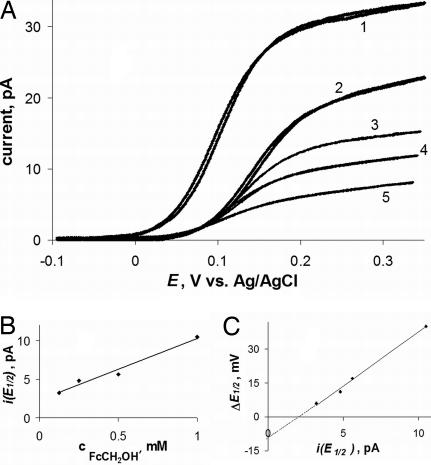
Fig. 4.
Voltammograms of FcCH2OH at a 112-nm Pt tip obtained in the bulk solution (curve 1) and inside the same cell (curves 2–5) (A), and corresponding dependences of i(E1/2) vs. cFcCH2OH (B) and ΔE1/2 vs. i(E1/2) (C). (A) cFcCH2OH (in mM) was: 1 (curves 1 and 2), 0.5 (curve 3), 0.25 (curve 4), and 0.125 (curve 5).

