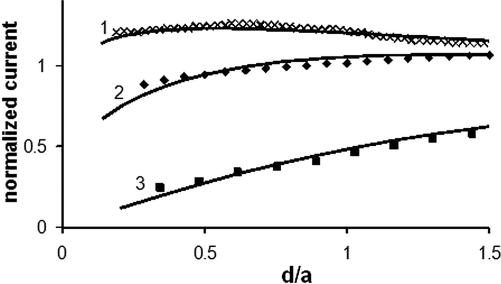
Fig. 5.
Evaluating the rate of charge/mass transport across the cell membrane from SECM approach curves. The tip radius (in nm) was: 790 (curve 1), 280 (curve 2), and 146 (curve 3). Experimental data (symbols) was fitted to the theory (solid lines) for finite charge transport kinetics (31) (curves 1 and 2) and pure negative feedback (28) (curve 3).

