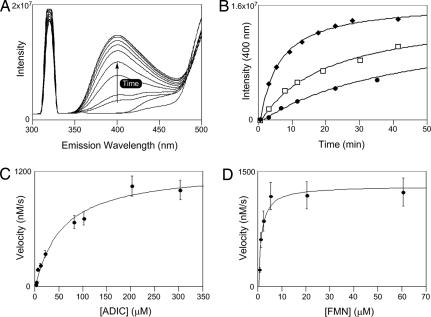
Fig. 5.
Kinetic analysis of SgcG. (A) Fluorescence-based assay development for SgcG with an excitation at 316 nm and emission at 400 nm. Each line represents a wavelength scan at different time points ranging from 0 to 50 min. (B) Time-course analysis of the SgcG reaction after the increase in emission intensity with different enzyme concentration: filled squares, 1× SgcG; open squares, 2× SgcG; filled circles, 4× SgcG. (C) Single-substrate kinetic analysis with variable ADIC and saturating FMN. (D) Variable FMN and saturating ADIC.

