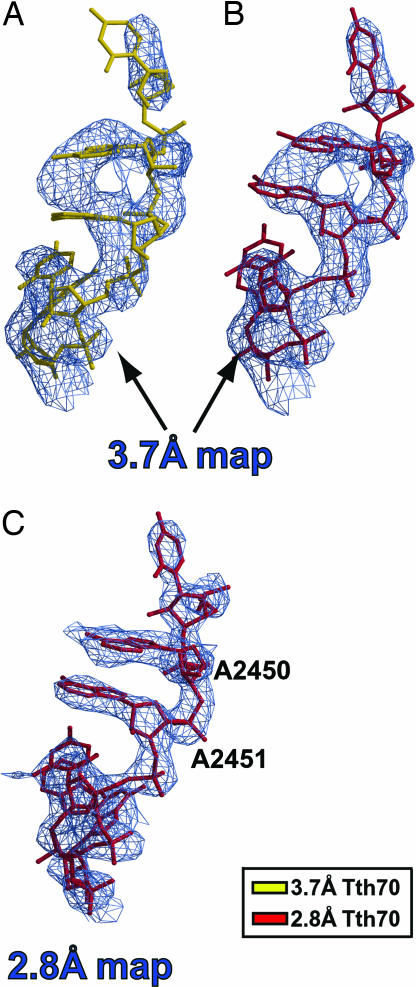
Fig. 1.
Superposition of the 3.7 Å and 2.8 Å models on cross-crystal averaged maps of the PTC. (A) The 3.7 Å model (gold) does not fit the 3.7 Å density-modified map contoured at 1.5σ. (B) Conversely, the 2.8 Å model (crimson) agrees with the resulting map. (C) The 2.8 Å cross-crystal averaged map after omitting the PTC–CCA from averaging, with the corresponding model in crimson superimposed. The map is contoured at 1.2σ.

