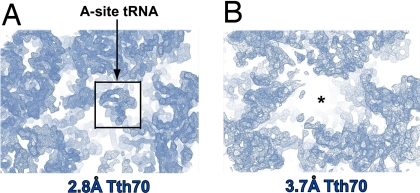
Fig. 4.
Unbiased electron density maps produced by cross-crystal averaging. (A) The averaged electron density for the anticodon stem loop of the A-site tRNA reappeared only in the 2.8 Å map. (B) On the other hand, the 3.7 Å map did not contain any density in the same area. The black box demarcates the tRNA electron density. The maps are contoured at 1.5σ.

