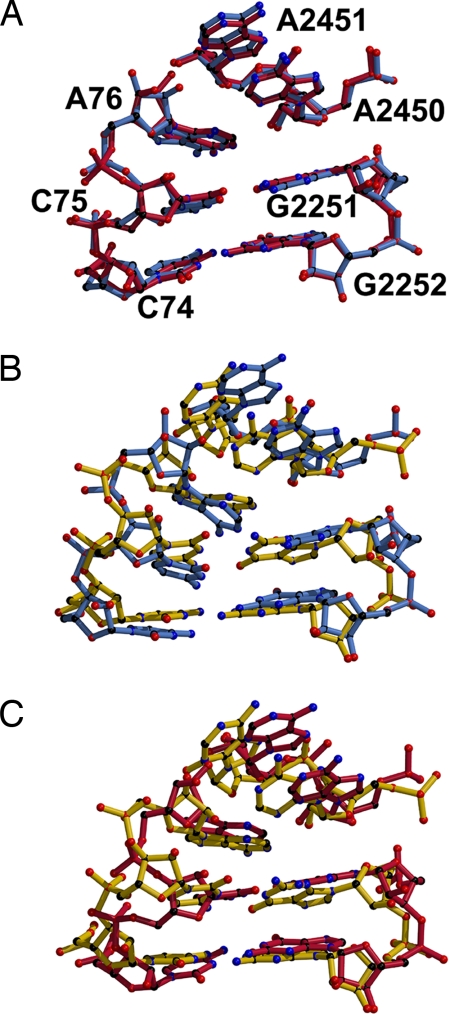
Fig. 6.
Comparison of the two Tth70 and the Hma50 models in the region of the PTC–CCA interface. (A) Superposition of the Hma50 PTC–CCA (blue) onto the 2.8 Å Tth70 structure (crimson). (B) Superposition of the Hma50 (blue) onto the 3.7 Å Tth70 structure (gold). (C) Comparison of the 2.8 Å Tth70 (crimson) and the 3.7 Å Tth70 (gold) models.

