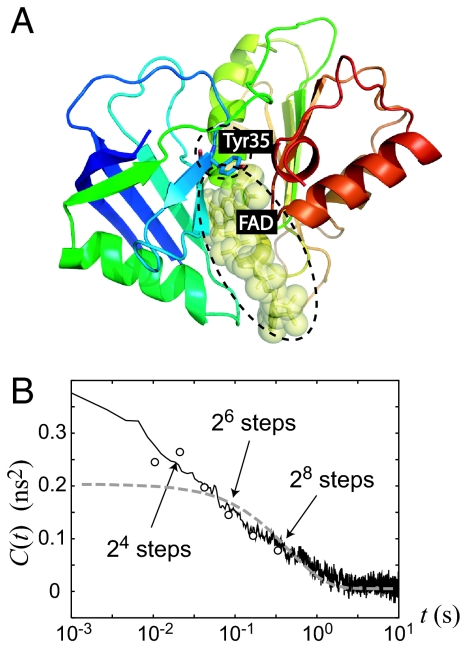
Fig. 4.
Visualization of the chromophore in protein and its fluctuation correlation. (A) The protein structure of Fre/FAD complex. The tyrosine residue Tyr35 and the FAD substrate, which are responsible for the fluorescence quenching, are shown in the dash circles. (B) The autocorrelation function of fluorescence lifetime fluctuation 〈δγ−1 (t)δγ−1 (0)〉 evaluated by Eq. 6 with the transition time of 2n (n = 3, 4, …, 8) (denoted by the circles) in linear-logarithmic plot. For comparison, the previous numerical result from a photon-by-photon-based calculation is also depicted (the solid line) together with the normal Brownian diffusion model (gray dashed line) represented by the overdamped Langevin equation on a harmonic potential well presented in Fig. 2. θ and λ are set to be 0.19 Å2 and 1.73 s−1, respectively, with β = 1.4 Å−1 (15). The arrows indicate the time scales at which 〈δγ−1 (t)δγ−1 (0)〉 is evaluated according to the multiscale SSNs shown in Fig. 5. The results indicate that the SSN indeed captures the system's multiscale dynamics.

