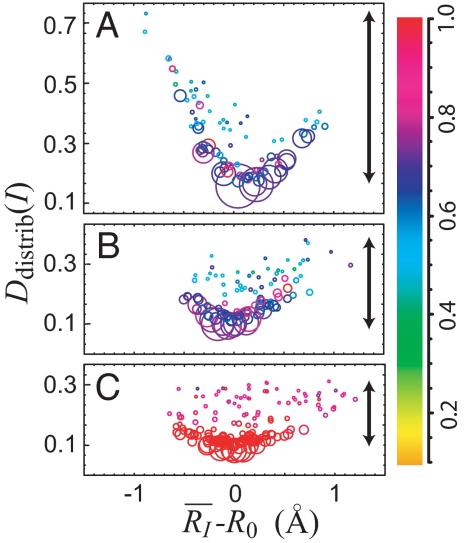
Fig. 5.
The dependence of the topographical feature of SSNs on the time scales: εA(4),D(4),D(3) with 24 steps (≈ 30 ms) (A), εA(6),D(6),D(5) with 26 steps (≈ 120 ms) (B), and εA(8),D(8),D(7) with 2 8 steps (≈ 500 ms) (C). The abscissa and ordinate denote the average interdye distance R̄I − R0 evaluated by −β log γ̄I and the average D–D distance Ddistrib(I) associated with the Ith state in each SSN, respectively. The area of the circle is proportional to the resident probability of the state and the arrow indicates the variance of Ddistrib(I). States of distinct Ddistrib but exhibiting the same (R̄I − R0) can now be resolved, lifting the degeneracy (cf. Fig. 2 where there is no degeneracy). See text for more detail.

