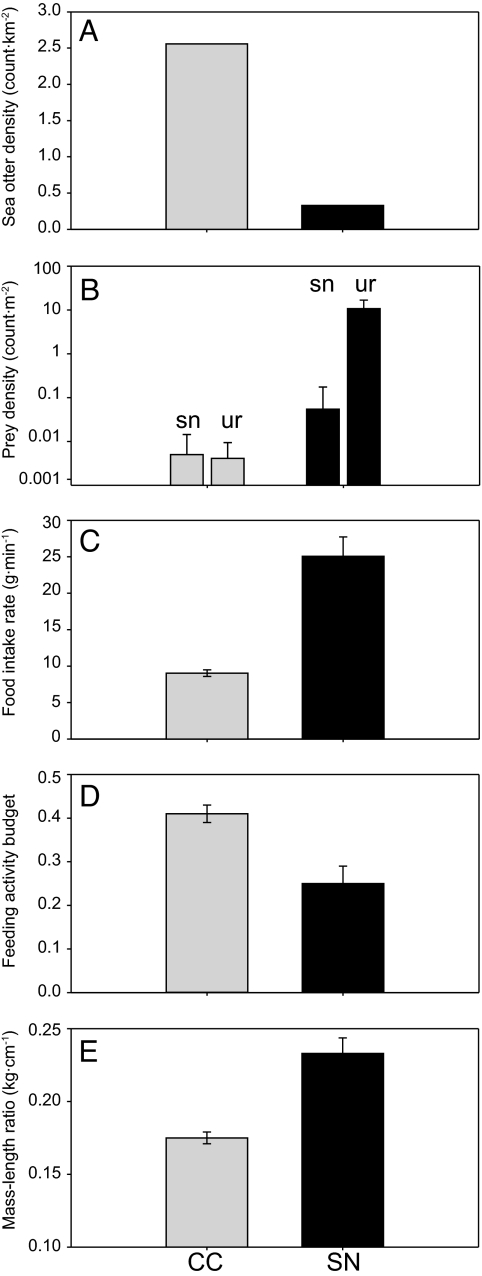
Fig. 1.
A comparison of summary statistics that together characterize sea otter population status and prey abundance at two study sites in California, CC (gray bars) and SN (black bars). (A) Sea otter population density (km−2). (B) Estimates of the benthic density (m−2) of two commonly consumed sea otter prey taxa: sn, marine snails (Astraea sp.), and ur, sea urchins (Strongylocentrotus spp.). (C) Estimated mean rate of biomass intake (g·min−1) by foraging sea otters. (D) The mean proportion of time spent feeding. (E) Body condition of adult sea otters (mass/length ratios). Error bars plotted in B–E represent ± 1 SE.

