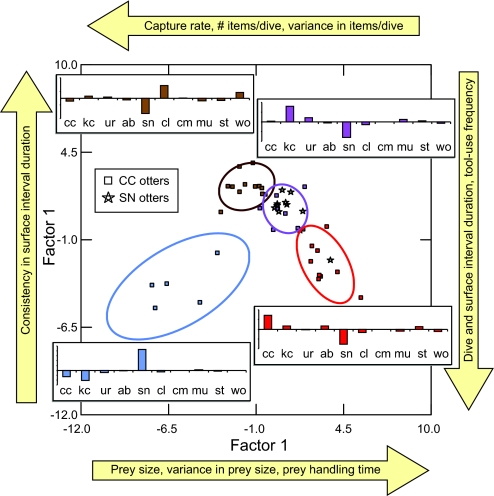
Fig. 3.
An ordination of the first two factors from a discriminant analysis conducted to evaluate the classification of individual sea otters into one of four clusters on the basis of foraging behavior. Each factor represents a canonical function of 14 parameters recorded from study animals at two study sites, CC and SN, and factor scores for individual otters are plotted in this multivariate space. To aid in interpretation, the qualitative relationship between key behavioral variables and the discriminant factors is indicated by arrows and text outside the ordination. Individuals are color-coded on the basis of the behavioral cluster to which they were initially assigned, and the 95% bivariate confidence ellipses for each cluster are also plotted. Histogram panels are superimposed adjacent each cluster (color-coded as above) to depict the mean relative abundance of 10 key prey types in the diets of the CC otters within that cluster, expressed as proportional discrepancies from the population average (two-letter prey codes are defined in Fig. 2, and vertical axis tick marks are at intervals of 0.05).

