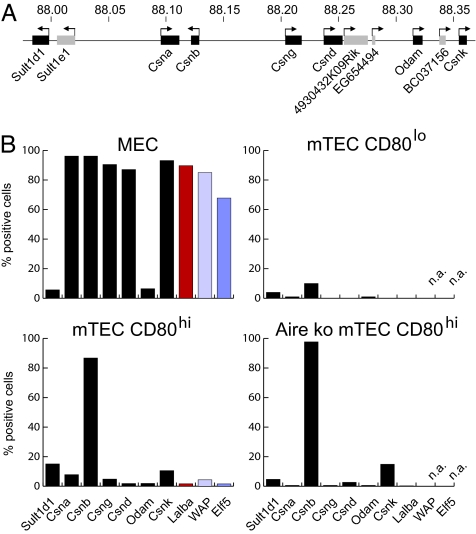
Fig. 1.
Expression frequencies of mammary gland-specific genes differ between MEC and mTEC subsets. (A) Diagram of the casein gene region on chromosome 5. Genes analyzed in this study are shown in black, and genes not analyzed are shown in gray. Numbers indicate chromosomal position in megabases. (B) Gene expression was assessed by single-cell PCR in sorted MECs (263 cells), CD80hi mTECs of C57BL/6 (664 cells), or Aire KO mice (343 cells) and in CD80lo mTECs of C57BL/6 mice (100 cells). Genes of the casein gene locus are shown in chromosomal order in black and Lalba (chromosome 15) in red. The expression of Elf5 and its target gene WAP (chromosomes 11 and 2, respectively) was assessed in only approximately one-third of total cells analyzed (blue). The absolute number of positive cells was calculated by adding up all cells in which at least one of the genes analyzed was detectable. The surface molecule EpCAM, which served as sorting marker for all cell types, was detected in 94–99% of positive cells. n.a., not analyzed.

