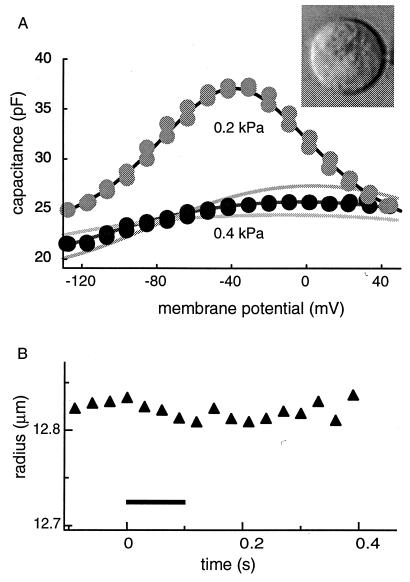
Figure 2.
The membrane capacitance and the cell radius examined with the short waveform (105 ms long with 3-ms steps). By applying pressure of 0.5 kPa to the patch pipette, the trypsin-containing (0.2 mg/ml) pipette medium is injected into the cell. The cell shape turns into a sphere (Inset). The same cell is shown in Fig. 1. (A) The membrane capacitance obtained with the short voltage waveform has a shallow bell-shaped voltage dependence at 0.4 kPa pipette pressure (●). When pipette pressure is reduced to 0.2 kPa ( ), the membrane potential shows a voltage dependence as large as the one obtained before trypsin digestion (1A). (B) The cell does not show a noticeable radius changes during the waveform, which starts from time 0 and lasts for 105 ms (▴). The duration of the waveform is marked with a bar. Pipette pressure (P0) is 0.4 kPa. The upper solid line in A represents a fit to Eq. 1 with q* = q, Cpk = 4q2N/kBT, and q*Vpk = ΔF′0. The fit gives q = (0.90 ± 0.4) e, N = (2.2 ± 0.2) × 107, Vpk = (−38.7 ± 0.5) mV, and Clin = (22.3 ± 0.6) pF. The lower dark line is a fit to a two-state model with a constant area constraint, by using the same values for q and N (see text). The parameter values used are: K = 0.13 N/m, q = 0.9 e, n = 2.2 × 10⁷, a = 5 nm2, and Clin = 16 pF. The reason for the difference in the linear capacitance is unclear. The two lighter lines represent 10% increase (Lower) and decrease (Upper), respectively, in the parameter a, which is the area difference in the two motor states. An additional source of error in estimating the area difference a is the uncertainty in parameters K and n (= N/4πR2), because the quantity Kna2 works as one parameter in Eq. 2. This factor leads to about 10% error in estimating a for a given value of q.

