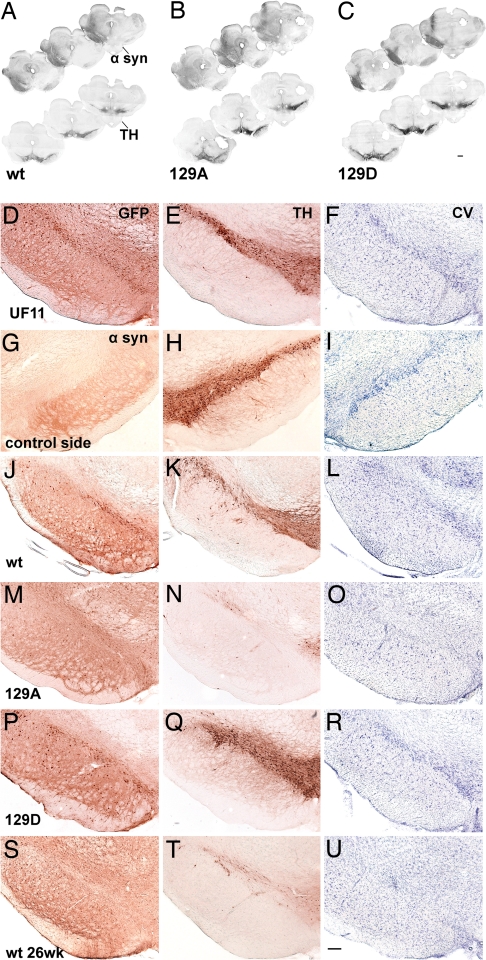
Fig. 3.
Photomicrographs showing nigral degeneration in the rAAV-α-syn-injected animals. (A–C) Montages of rostral-to-caudal coronal sections illustrate transduction volume in different experimental groups at 8 wk postinjection (α-syn-stained sections, Upper) and a reduction of TH immunoreactivity on the injected side of parallel sections (Lower). These sections were labeled with standard DAB immunohistochemistry (see Materials and Methods). (D–J) Each row contains neighboring sections, taken from the same animal, that illustrate cells immunostained for GFP (D), α-syn (G, J, M, P, S) and TH (E, H, K, N, Q, T), and CV-stained cells (F, I, L, O, R, U) in the SN at 8 (D–R) and 26 (S–U) wk postinjection. The sections were uninjected (G–I) or injected with UF11 (which expresses GFP, D–F), wt-α-syn (J–L, S–U), 129A (M–O), 129D (P–R). Whereas expression of GFP protein (D–F) or 129D (P–R) did not alter the number of TH-positive neurons or CV-stained neurons, the expression of 129A (M–O) or wt (J–L and S–U) α-syn led to loss of TH-positive neurons and CV staining in the SNc, compared with the contralateral intact side (G–I). (Scale bars: A–D, 1 mm; E–V, 250 μm.)

