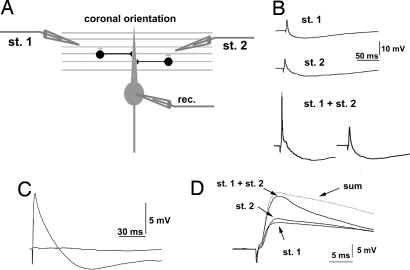
Fig. 3.
FFI and coincidence detection. (A) Recording configuration from PCs and FFI connection in coronal slices. The two simulating electrodes (st. 1 and st. 2) were placed at opposite sides relative to the recorded PC. (B) PSPs recorded in current-clamp mode. The upper two records show independent responses after subthreshold stimulation with st. 1 and st. 2. The lower two records show sample traces obtained with coincident stimulation (st. 1 plus st. 2, delay = 0 ms). The generation of a spike (Left) and a failure (Right) demonstrates the threshold for action potential generation. (C) Disynaptic activation of inhibition through PF stimulation. Bath application of 10 μM NBQX abolished both the excitatory and the inhibitory components of the PSP, demonstrating that the latter was disynaptically driven by PFs. (D) Stimulation of two independent PF beams. The two beams were considered independent when the amplitude of the PSP obtained with coincident subthreshold stimulation (st. 1 plus st. 2, delay = 0 ms) was at least 80% of the amplitude obtained by summing single PSPs (sum).

