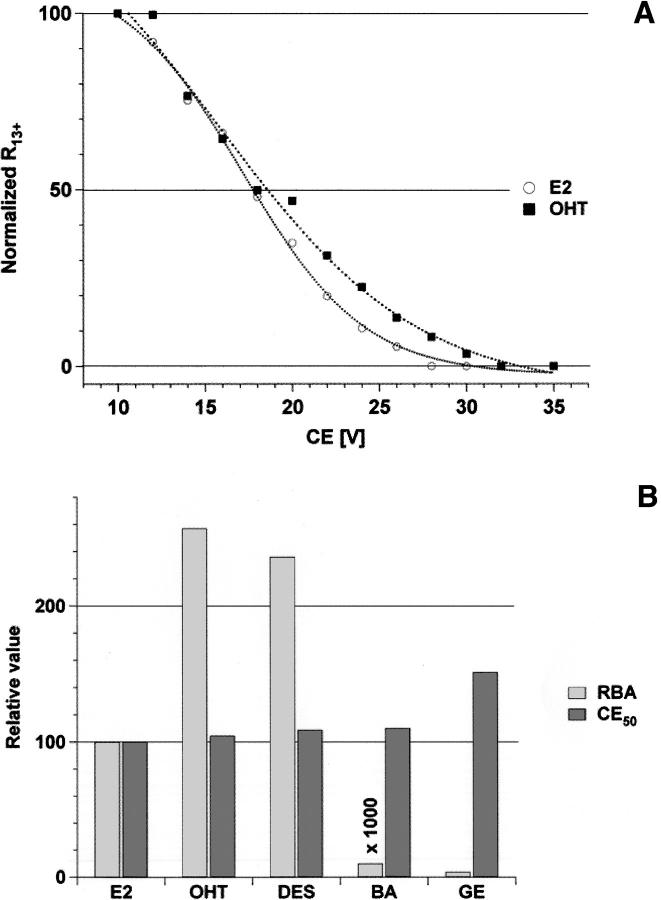
Figure 4.
(A) Normalized bound to free protein intensity ratio R of the noncovalent complexes between hERαLBD and its target ligand E2 and OHT as a function of the collision energy (CE). CID analysis was performed on the hERα LBD monomer charged state +13. (B) Comparison of the relative CE50 and the relative binding affinity (RBA) in solution (Kuiper et al. 1998) for hERα LBD and its target ligand.

