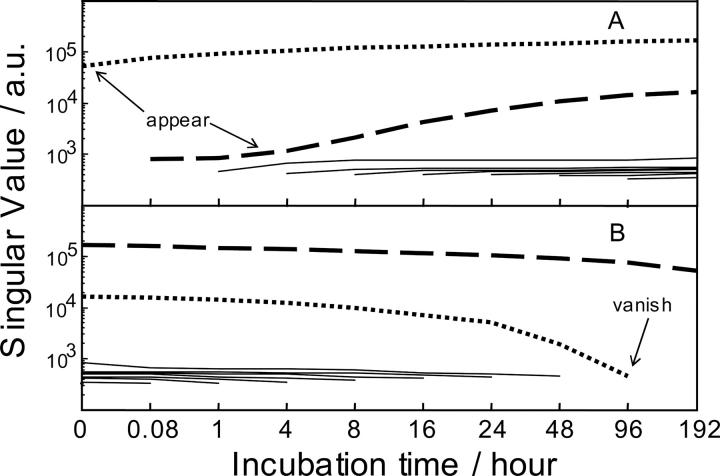
Figure 7.
Results of the evolving forward (A) and reverse (B) factor analysis: Singular values versus the order number of fluorescence spectrum. Each curve on the graph shows the relative contribution (eigenvalue) of each factor in the subsets of first two, first three, etc., samples for forward (A) factor analysis and the eigenvalues for last two, last three, etc., samples for reverse (B) factor analysis. Dotted curves represent the eigenvalues for the folded conformer; dashed curves represent the eigenvalues for the unfolded conformer. The other curves (solid lines) on the background level signify error factors.

