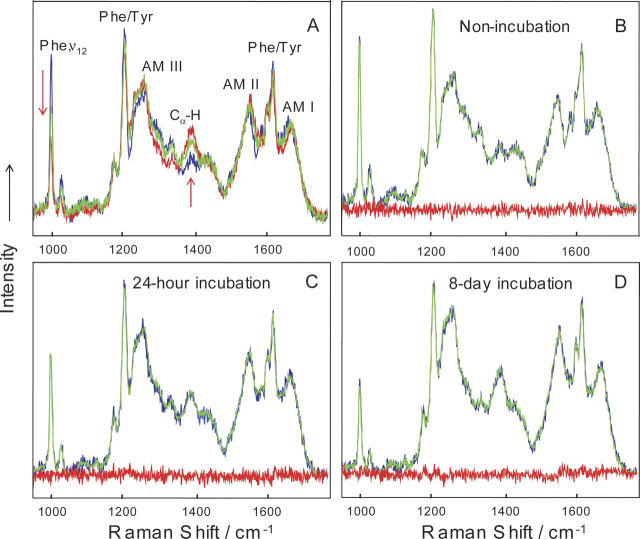
Figure 8.
DUVRR spectra of compact lysozyme (nonincubated, blue), soluble fractions of 24-h incubated (green) and 8-d incubated (red) lysozyme (A). Spectra were normalized by using internal standard sodium trifluoroacetate. The fittings of the DUVRR spectra of nonincubated lysozyme (B), soluble fractions of 24-h incubated (C), and 8-d incubated lysozyme (D) using basis spectra calculated from alternating least squares analysis are shown (blue indicates experimental spectra; green, fitted spectra; red, residue spectra). All spectra were measured at room temperature. Amide I band (AM I) consists of carbonyl C=O stretching, with a small contribution from C−N stretching and N-H bending; Amide II (AM II) and Amide III (AM III) bands involve significant C−N stretching, N–H bending, and C−C stretching; The Ca−H bending vibrational mode involves Ca−H symmetric bending and C−Ca stretching (Chi et al. 1998). Phe indicates phenylalanine; Tyr, tyrosine.

