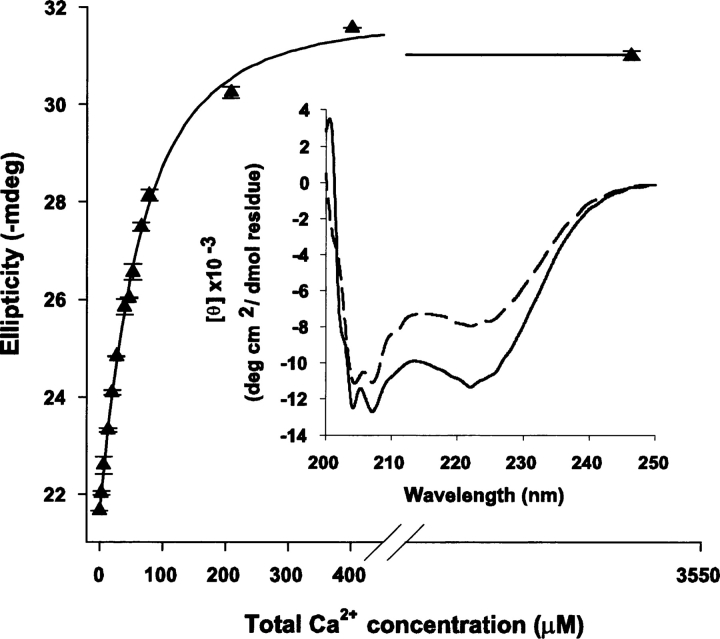
Figure 2.
Ca2+ titration of CaM2/3 monitored by CD spectropolarimetry. The mean ellipticity at 222 nm with standard deviations from four replicates (triangles), is plotted against total Ca2+ concentration and the fit line generated with the CaLigator software (Andre and Linse 2002). The plotted ellipticity data were not corrected for dilution. The total CaM2/3 concentration was 40 μM, and the apparent, stepwise Ca2+ dissociation constants are (mean and standard error) K d1 = 30 ± 5 μM and K d2 > 1000 μM (25°C, pH 7.4). Binding of the first Ca2+ accounts for ∼90% of the total induced CD change. (Inset) The far-UV CD spectra of Ca2+-free (dashed line) and fully Ca2+-ligated (solid line) CaM2/3.

