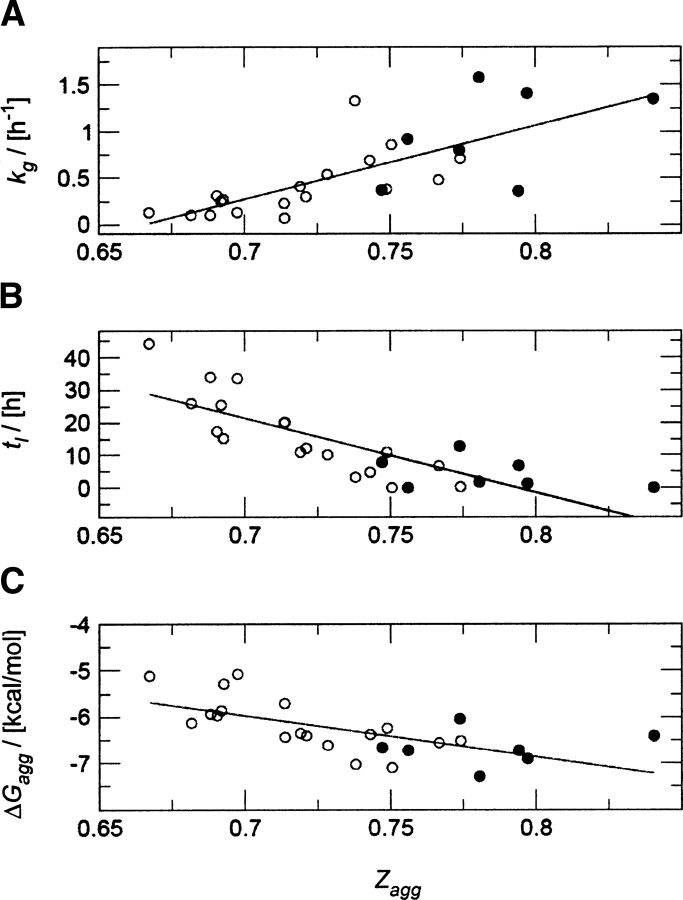
Figure 4.
Correlation between the experimental measurements (kg, tl, and ΔGagg) and the predicted aggregation propensities (Zagg): (A) kg and Zagg (coefficient of correlation 0.76), (B) tl and Zagg (coefficient of correlation −0.82), (C) ΔGagg, and Zagg (coefficient of correlation −0.66). Filled symbols indicate natural Aβ(1–40) variants and open symbols the data from valine 18 variants of Aβ(1–40).

