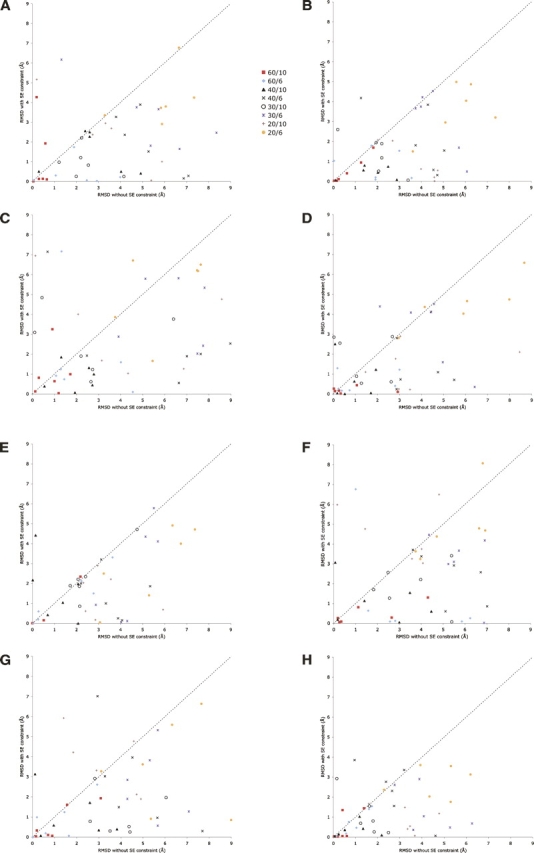
Figure 1.

(A) Modeling results for ribosomal structure (1ctf). This graph compares the RMSD of resulting models of 1ctf, derived both with and without SE data. In all modeling runs, sets of interatomic distances were included spanning 20%–60% of short-range distances, as described in the text. The distance range was taken as either 6 or 10 Å. The key indicates the percentage and distance range applied. (B) Modeling results for protein 1myt; (C) modeling results for plant seed protein Crambin, 1crn; (D) modeling results for virus coat protein, 2bbv; (E) modeling results for chain B of the HPP precursor protein, 1ivy; (F) modeling results for chain O of the RNA binding attenuation protein, 1wap; (G) modeling results for actin binding protein, 1svr; and (H) modeling results from chain E from the virus coat protein, 2bbv.
