
Figure 3.
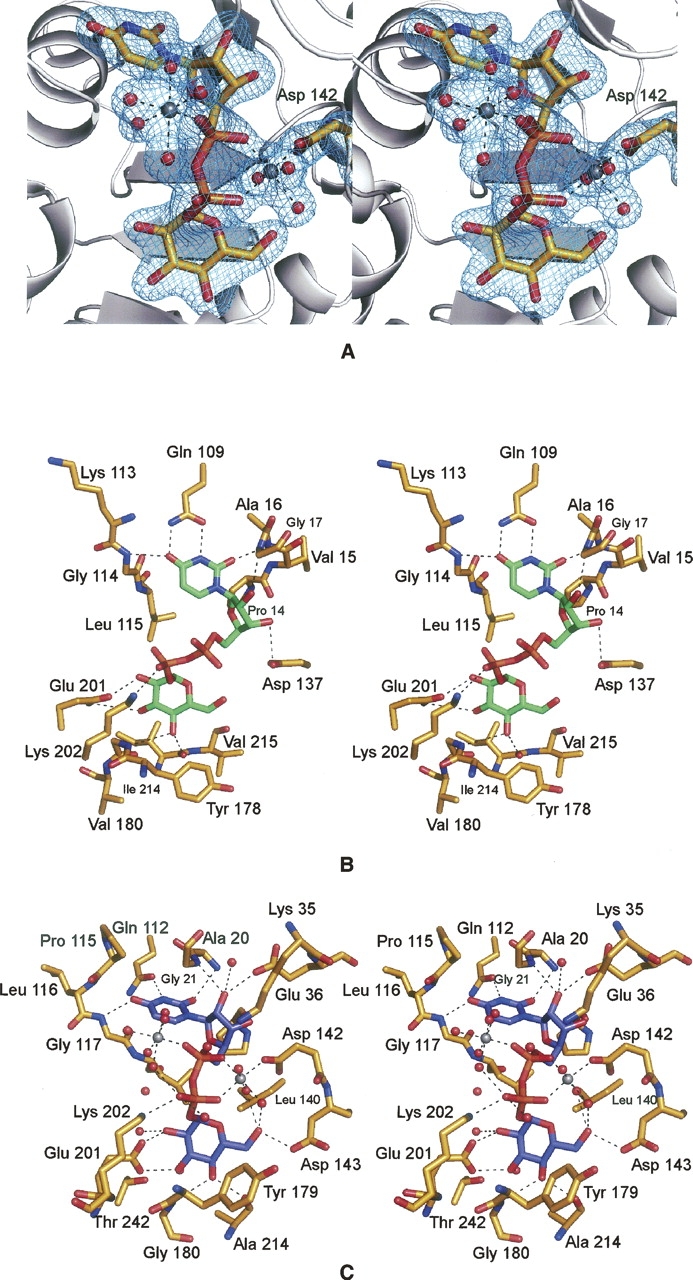
UGPase active sites. (A) Electron density corresponding to the two magnesium ions and UDP-glucose as observed in Subunit 1. The map was contoured at 4σ and was calculated with coefficients of the form (F O − F C), where F O and F C were the native and the calculated structure factor amplitudes, respectively. For the map calculation, the X-ray coordinates for the cations and the ligand were removed from the protein model. (B) Prediction of the UDP-glucose binding mode to E. coli UGPase. On the basis of the similarity between the E. coli forms of both UGPase and glucose-1-phosphate thymidylyltransferase, the manner in which UDP-glucose binds to UGPase was predicted as shown (Thoden and Holden 2007). UDP-glucose is displayed in green. Potential hydrogen bonds are indicated by the dashed lines. (C) Close-up view of the C. glutamicum UGPase active site. Those residues located within ∼3.2 Å of the UDP-glucose (highlighted in blue) are shown. Potential hydrogen bonds are depicted as dashed lines. The coordination geometries about the two magnesium ions, displayed in gray, are also indicated by dashed lines. Ordered water molecules are represented as red spheres.