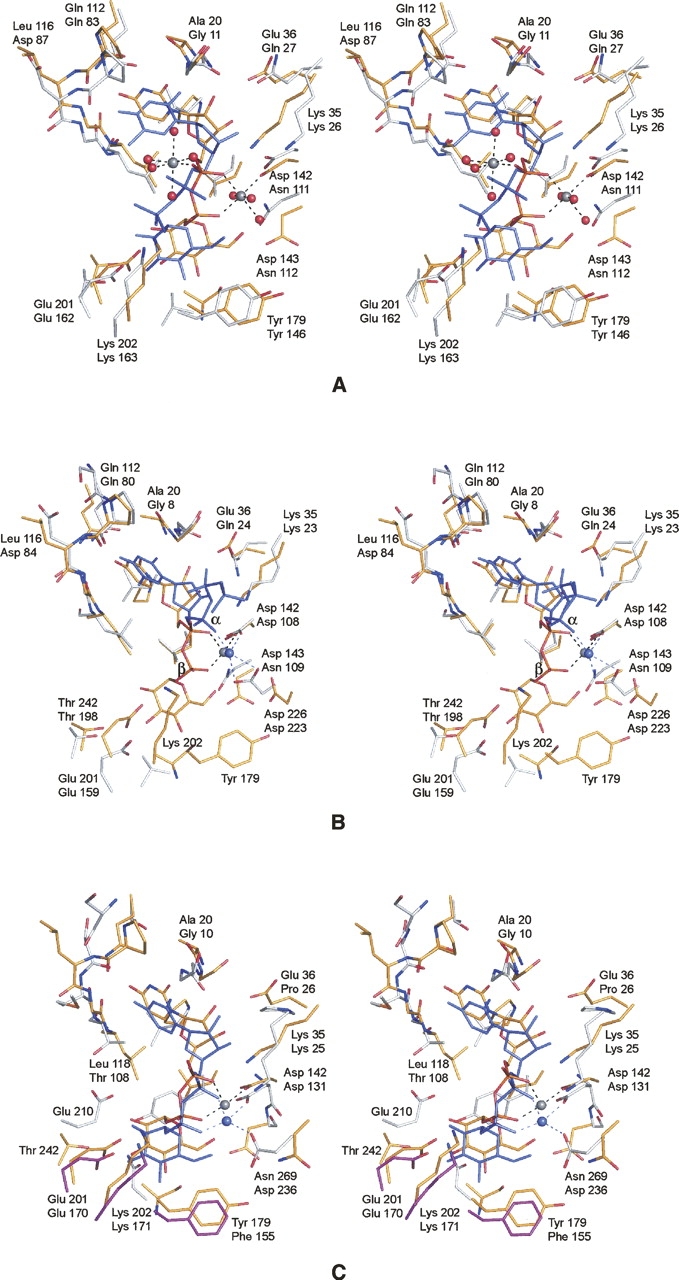
Figure 5.

Comparison of UGPase with glucose-1-phosphate thymidylyltransferase and glucose-1-phosphate cytidylyltransferase. (A) Comparison of UGPase and the E. coli thymidylyltransferase complexed with UDP-glucose. X-ray coordinates for the thymidylyltransferase were obtained from the Protein Data Bank (accession code no. 1H5T). The protein atoms and the UDP-glucose ligand in the UGPase model are depicted in yellow bonds. The corresponding residues in the thymidylyltransferase are displayed in white bonds, whereas the UDP-glucose is depicted in blue. In each pair of labels, the top and bottom numbers refer to residues in UGPase and the thymidylyltransferase, respectively. (B) Comparison of the UGPase structure to the E. coli thymidylyltransferase complexed with magnesium and dTDP. The color coding is as described in A. X-ray coordinates were obtained from the Protein Data Bank (accession code no. 1MC3). Note the close structural correspondence of the bound magnesium ions. (C) Comparison of UGPase to glucose-1-phosphate cytidylyltransferase from Salmonella typhi. The color scheme is as described in A except for Glu 170, Lys 217, and Phe 155, which in the cytidylyltransferase are magenta to emphasize that they are contributed by a second subunit in the hexamer.
