
Figure 5.
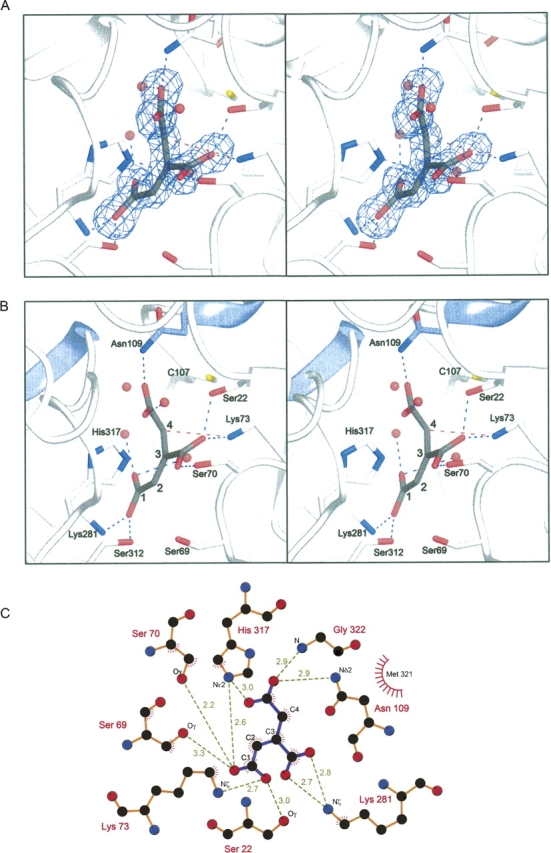
Details of the interaction of trans-aconitate with PrpF. (A) Stereoview of the electron density corresponding to trans-aconitate. The map, contoured at 3σ, was calculated from coefficients of the form F o–F c, where the ligand was omitted from the phase calculation and refinement. (B) Stereoview of the active site depicting the residues that interact with trans-aconitate. The N termini of the buried α-helices are colored in blue and show that the helices are directed toward C4 of the substrate. (C) Schematic representation of the interactions made by PrpF with trans-aconitate. Polar interactions and distances in Å are indicated as green dashed lines. Figure 5C was produced with the program LIGPLOT (Wallace et al. 1995).