
Figure 7.
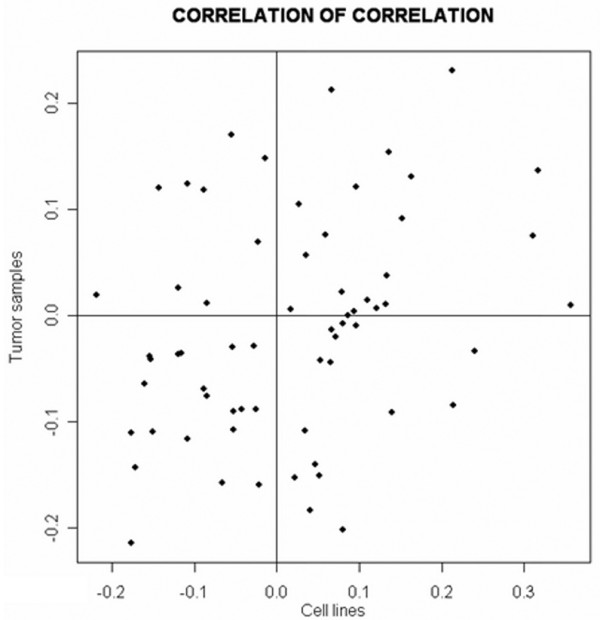
Scatterplot of pair-wise correlation comparison within the probe sets in the two datasets. Integrative correlation coefficient [40] was used to quantify the extent of the similarity between the tumour specimens and breast cancer cell line transcription profiles. All pair-wise correlations (Pearson correlation coefficient) of gene expression across samples within individual projects were calculated, and the reproducibility of the results was defined without relying on direct comparison of expression across platforms.