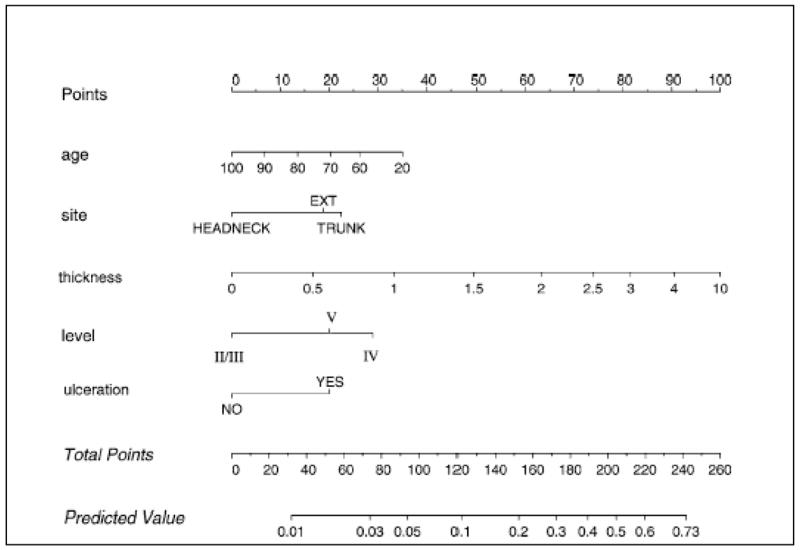
Figure 2.

Nomogram to predict positive sentinel lymph nodes. How to use the nomogram: The patient’s values on each axis are located, and a line is drawn upward to determine how many points the patient receives for each variable value. The points are summed; that number is located on the ‘‘total points’’ axis. A line is drawn downward to then determine the predicted probability of sentinel node positivity. Reprinted with permission from Wong et al.28
