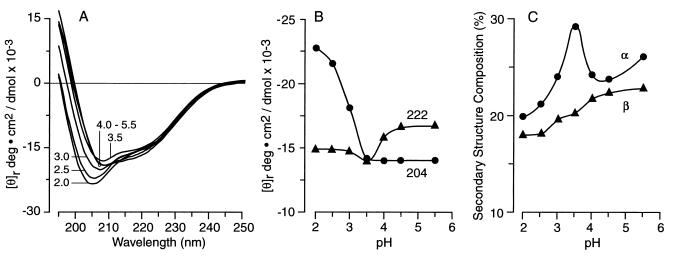
Figure 2.
Effect of pH on protein conformation. (A) Unsmoothed far-UV CD spectrum of N-62 StAR protein, recorded between 190 nm and 250 nm and equilibrated at the pH values shown. (B) Correlation between [θ]204 and [θ]222 and pH, indicating the increase in random coil below pH 4 and the retention of secondary structure, even down to pH 2.0. (C) Correlation between secondary structure as represented by the percentage α-helix and β-sheet compositions and pH, suggesting an increase in helicity at pH 3.5.

