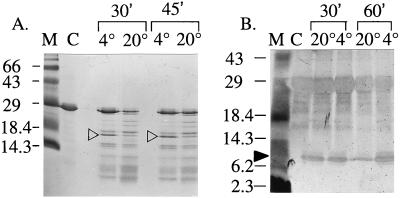
Figure 4.
Proteolytic digestion of N-62 StAR. (A) Trypsin digestion of 5 μg samples of N-62 StAR for 30 or 45 min at 4°C or 20°C as indicated, displayed on 20% acrylamide and stained with Coomassie blue. The ≈16-kDa band (open arrowheads) was excised for mass spectrometric analysis. This photograph understates the differences in staining intensity in the original gels; the indicated bands were decidedly more prominent than any others. (B) Pepsin digestion of 1 μg samples of N-62 StAR for 30 or 60 min at 20°C or 4°C, as indicated, displayed on 20% acrylamide and stained with silver nitrate. The ≈8.5-kDa band (solid arrowhead) appeared as a doublet and hence was excised as two separate bands for mass spectrometric analysis. Peptides smaller than 10 kDa do not stain well.

