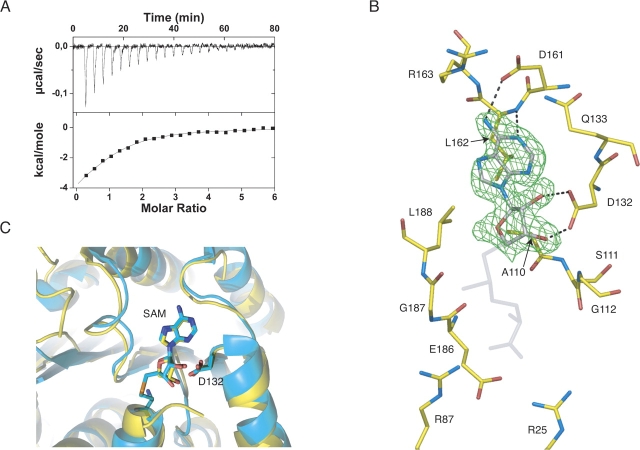
Figure 4.
(A) Isothermal titration calorimetry measurement of the binding of AdoMet to ML2640c protein at 25°C. Upper panel, row calorimetric data of the titration of AdoMet into ML2640c corrected for the heat of dilution of the ligand. Lower panel, integrated heats of injections with the solid line corresponding to the best fit to the data using MicroCal software (N = 1.0 ± 0.1, K d = 2.1 ± 0.3 μM, ΔH° = −6.1 ± 0.7 kcal/mol−1, TΔS° = +1.7 ± 0.6 kcal/mol−1). (B) Electron density (2Fo–Fc) map (contoured at 1 σ) of the bound substrate. Protein-substrate hydrogen bonding interactions are indicated, and other important residues (see text). (C) The methyl donor substrate occupies the same binding pocket in ML2640c (yellow) and PPM1 methyltransferase (cyan) (PDB code 1RJG).

