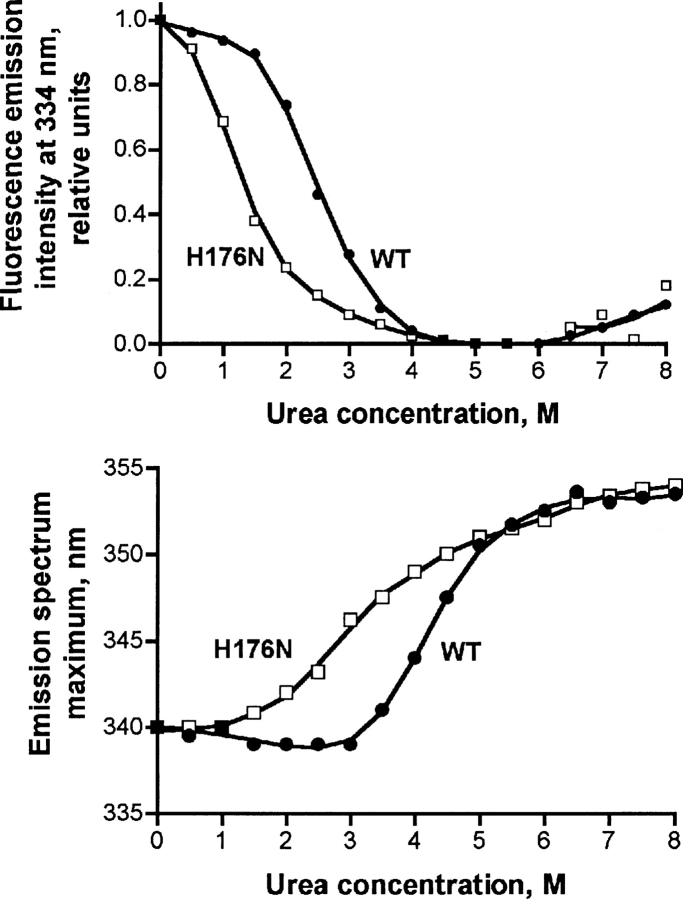
Figure 2.
Analysis of unfolding of WT and H176N mutant GNMT by fluorescence spectroscopy. (Top) Dependence of the intensity of fluorescence emission of GNMTs at 334 nm. (Bottom) Dependence of the maxima of emission spectra. Fluorescence emission spectra were recorded for wild-type (solid circles) and H176N mutant GNMTs (open squares) in 50 mM Tris-HCl, pH 8.0, 150 mM NaCl, 14 mM β-mercaptoethanol. Protein concentration was 0.05 mg/mL, cuvette of 1 cm optical length. The protein fluorescence was excited at 285 nm.

