
Figure 4.
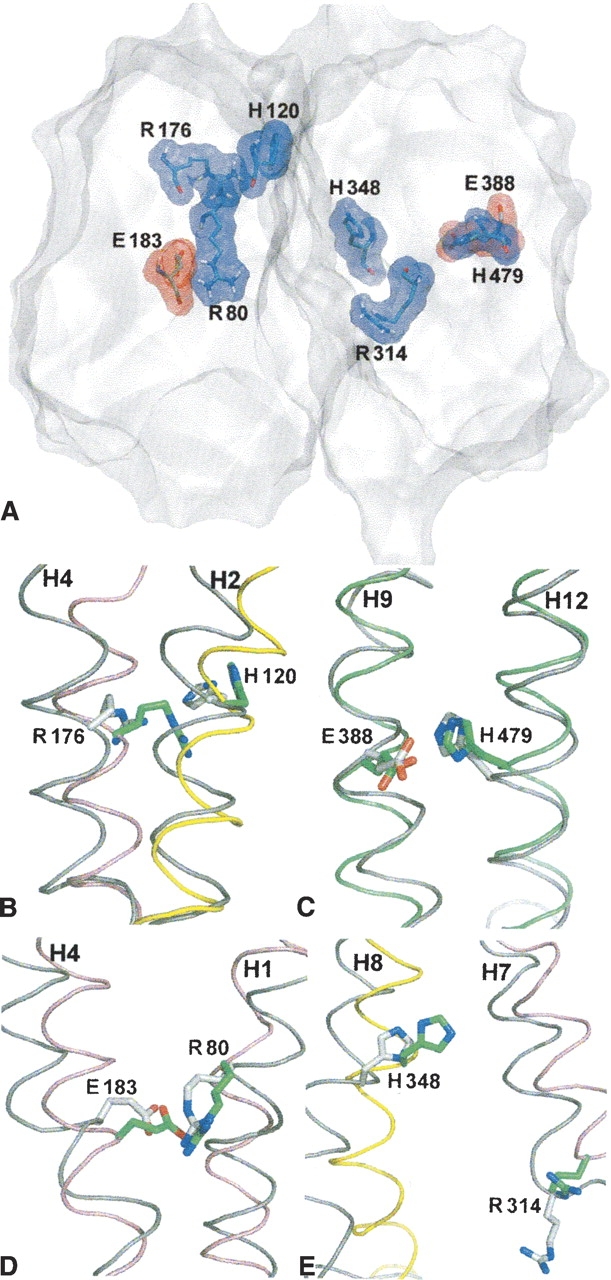
(A) Surface display of the VGLUT1 model cut in a plane parallel to the vesicle membrane, with all eight charged residues situated within the hydrophobic region of the membrane displayed. (B–E) The same residues viewed before (green) and after (gray) molecular dynamics simulation. Helices before MD simulation are colored as in ▶, helices after 10 nsec are colored in gray.