
Figure 5.
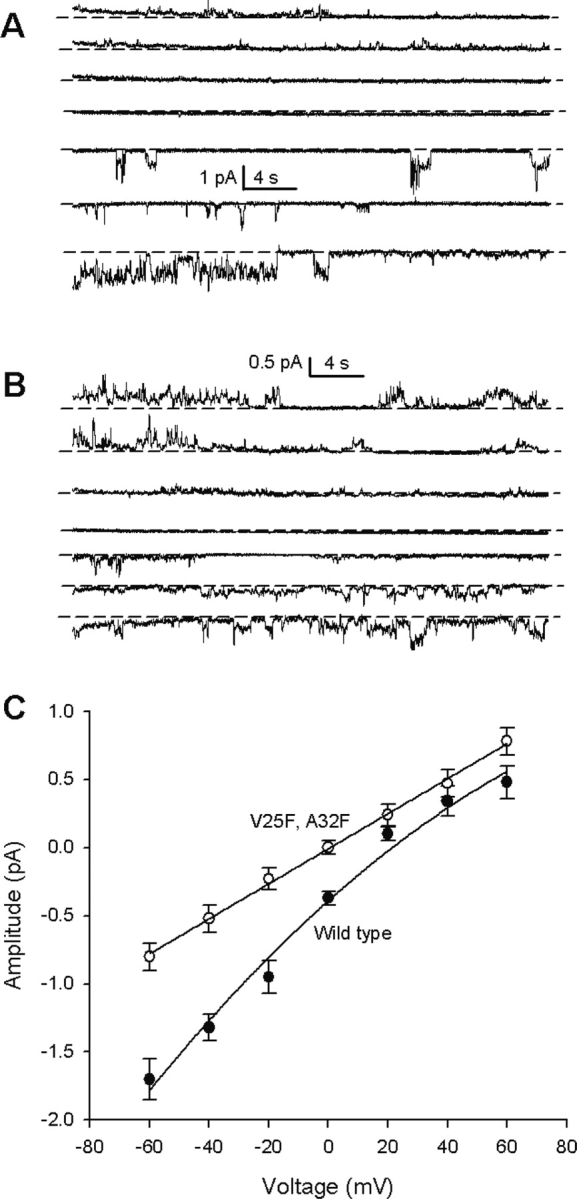
Comparison of ion selectivity (see Materials and Methods), with single-channel currents, between wild-type sequence (A) and V25F–A32F double mutant (B). Voltages are from −60 mV (bottom) to 60 mV (top), in steps of 20 mV. Short dashed lines indicate the closed state. The corresponding current–voltage relationship is shown in (C). A line is drawn only to guide the eye. Data for wild-type (•) and double-mutant V25F–A32F (○) are indicated. Vertical bars represent two standard deviations.