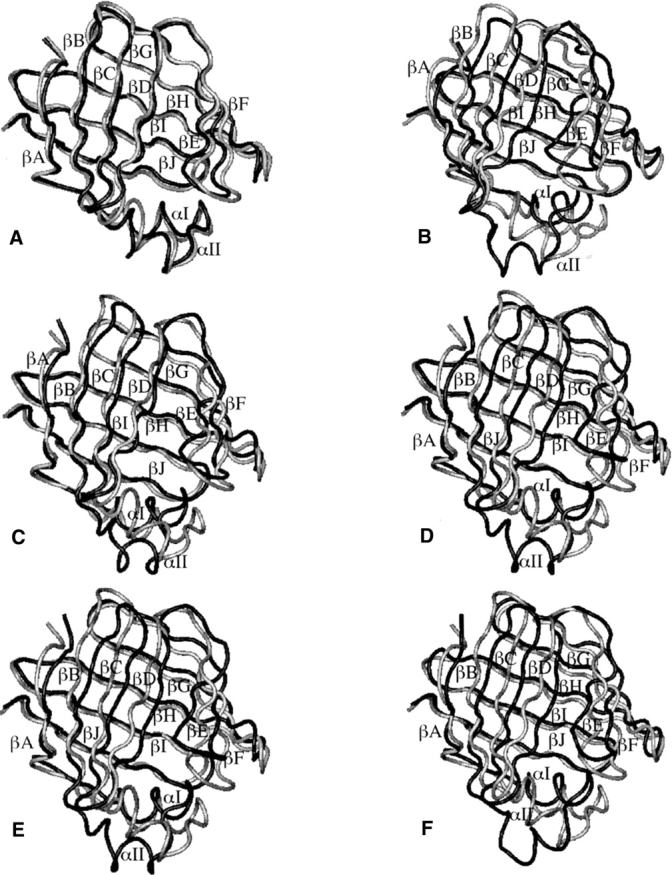
Figure 10.

The energy-minimized average structure of IFABP from the FA-transfer-through-the-alternative-portal-region MD simulation (colored in black) superimposed on the optimal structure (colored in gray). The average structure was calculated between 2 and 300 ps (A), 1166 and 1360 ps (B), 1442 and 1486 ps (C), 1580 and 3700 ps (D), 4078 and 4116 ps (E), and 4510 and 6000 ps (F).
