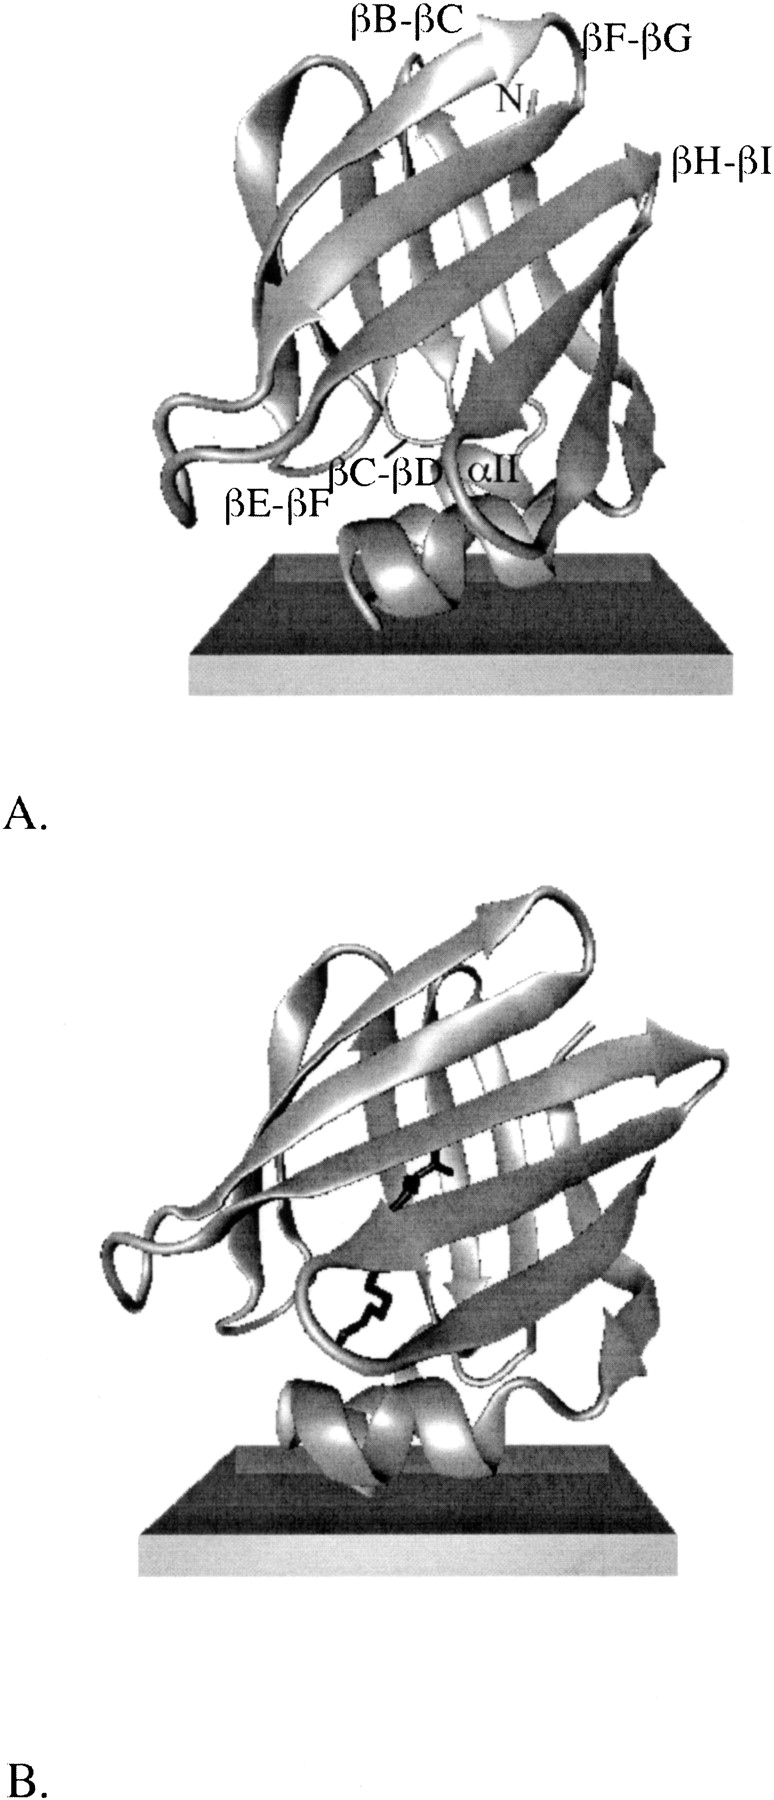
Figure 3.

The optimal orientation of apo-IFABP (A) and of IFABP bound with palmitate (B) relative to an anionic membrane. The structures are obtained at the end of 2-ns MD simulations, after energy minimization. The membrane is depicted by the rectangular box; the upper surface represents the plane of smeared charge (located at z = 16 Å); the lower surface represents the hydrophobic tail/headgroup boundary (located at z = 13 Å).
