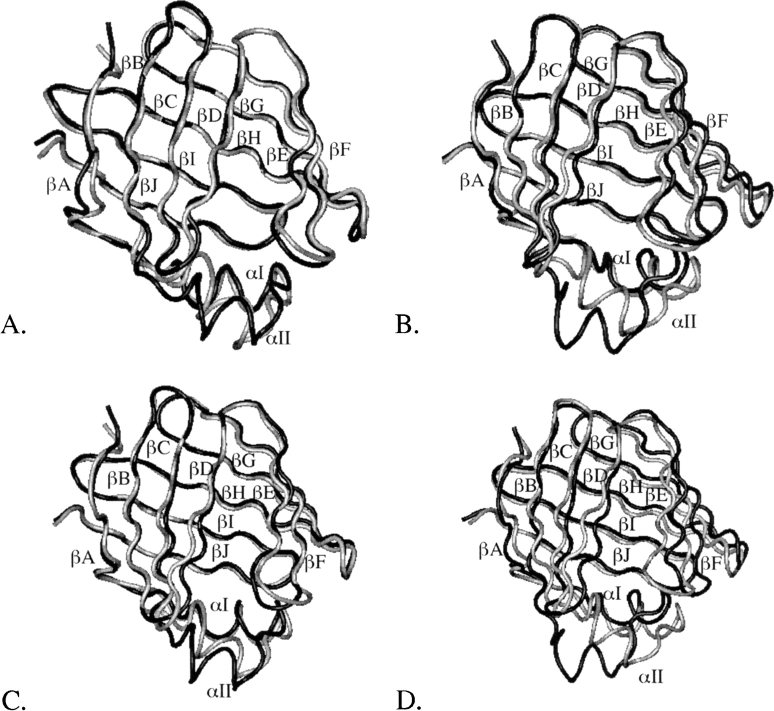
Figure 7.
The energy-minimized average structure of IFABP from the FA-transfer-through-the-helical-portal-region MD simulation (colored in black) superimposed on the optimal structure (colored in gray). The average structure was calculated between 272 and 292 ps (A), 312 and 335 ps (B), 350 and 404 ps (C), and 450 and 456 ps (D).

