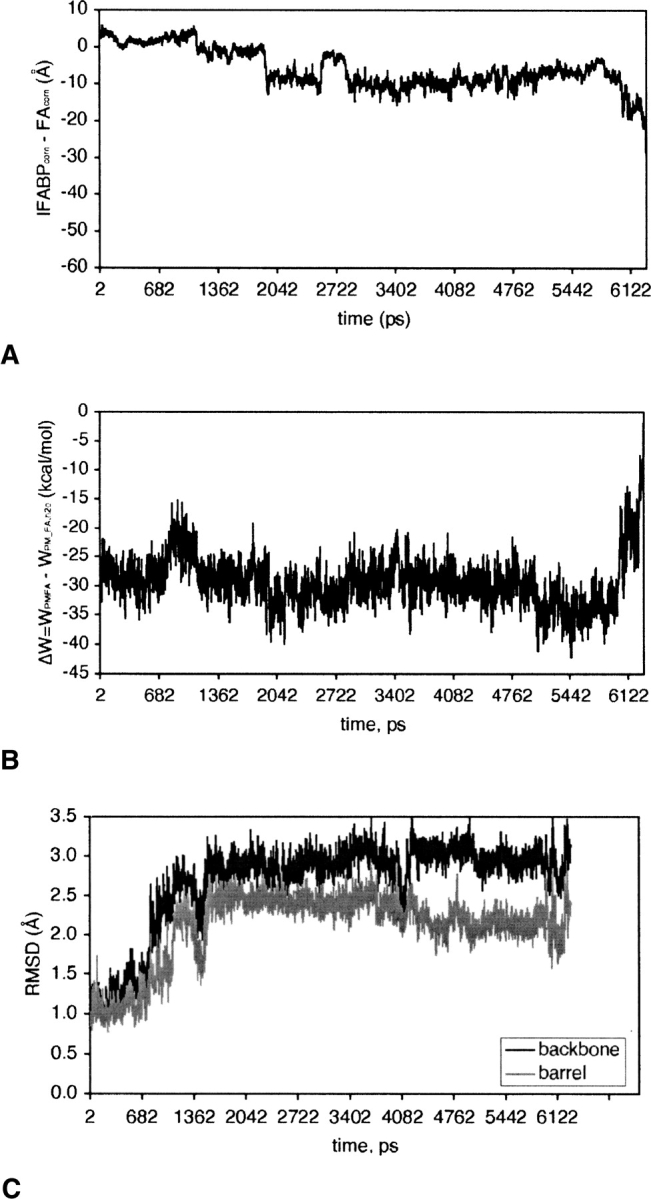
Figure 9.

(A) The distance between the center of mass of IFABP (IFABPcom) and that of palmitate (FAcom) during FA release from holo-IFABP through the alternative portal region. (B) The change in effective energy of FA during the release (see the caption of ▶ for details). (C) The RMSD of IFABP from the optimal structure during FA transfer.
