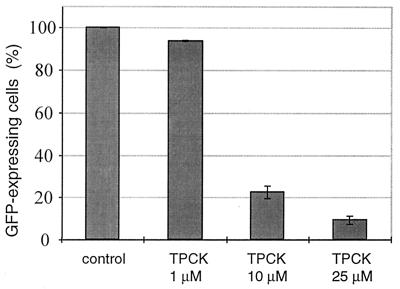
Figure 4.
Analysis of GFP expression in T. parva-transformed T cells undergoing apoptosis. Cells were transfected with the plasmid pCMV-GFPsg25 (50 μg) and treated for 5 h with TPCK as indicated. GFP expression was monitored in a counting chamber by using a fluorescence microscope. Error bars represent the SD for three independent experiments.

