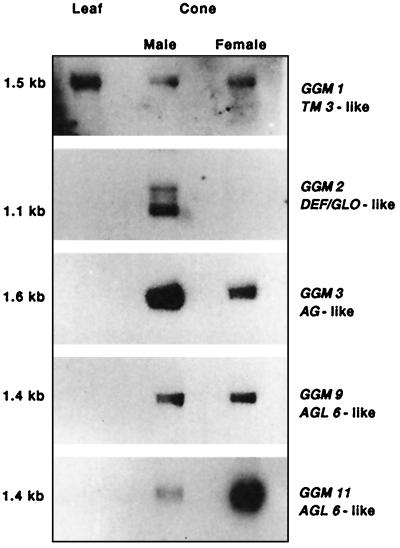
Figure 2.
Northern blot analysis of GGM gene expression. The names and subfamily memberships of the respective genes are indicated at the right. At the left, the apparent length of the major band is indicated in kb. RNA sources were young leaves and male or female cones from two individual G. gnemon trees as indicated.

