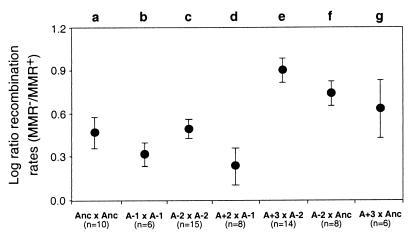
Figure 3.
Effect of MMR on recombination rates for different types of crosses. The y axis shows the log-transformed ratio of recombination rates measured for isogenic MMR− and MMR+ recipients during paired crosses with the same donor genotype. Higher values of the log-transformed recombination ratio indicate stronger inhibition of genetic recombination caused by functional MMR in recipient. Values are therefore expected to increase as a function of DNA sequence divergence between donor and recipient. (a–c) Three different self-crosses. (d) A cross between two lines that diverged for 20,000 generations as nonmutators. (e) A cross between two lines that diverged as mutators for most of 20,000 generations. (f–g) Two different crosses between lines that diverged as mutators and their common ancestor. Error bars are standard errors; n = number of replicate assays for each cross, where each replicate assay involves two paired crosses.

