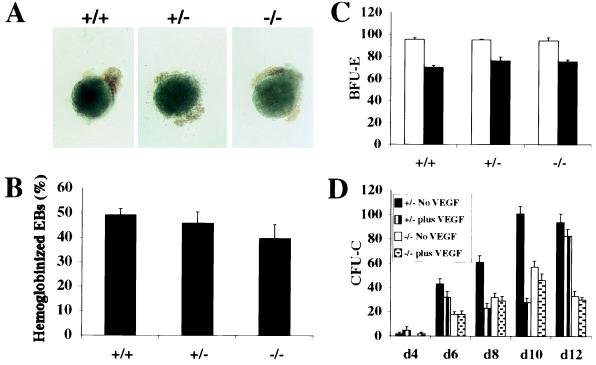
Figure 1.
Hematopoietic development in flk-1 mutant EBs. (A) Day-10 EBs derived from wild-type, flk-1 (+/−), and flk-1 (−/−) ES cells, showing hemoglobinized EBs for all ES cell clones. (B) Proportion of hemoglobinized EBs scored on day 10 after plating in methylcellulose. (C) The numbers of erythroid colonies in secondary methylcellulose culture of flk-1 (+/+), flk-1 (+/−), and flk-1 (−/−) EB cells. Numbers of erythroid colonies were determined by replating disaggregated day 7 EB cells in methylcellulose culture containing Epo (open column) and Epo/SLF (closed column). BFU-E, erythroid burst-forming units. (D) A time course of myeloid–erythroid colony assays of EB-derived hematopoietic progenitors. The number of cell colony-forming units (CFU-Cs; the y-axis) is calculated per 5 × 10⁵ EB input cells. d4, etc., day 4, etc. The black and vertically striped bars represent flk-1 (+/−) cultures without or with exogenously added mVEGF, respectively. The white and speckled bars represent flk-1 (−/−) cultures without or with exogenously added mVEGF, respectively. Both genotypes generated approximately the same proportions of BFU-E and granulocyte–erythrocyte–macrophage–megakaryocyte, granulocyte–macrophage, macrophage, and granulocyte colony-forming units.

