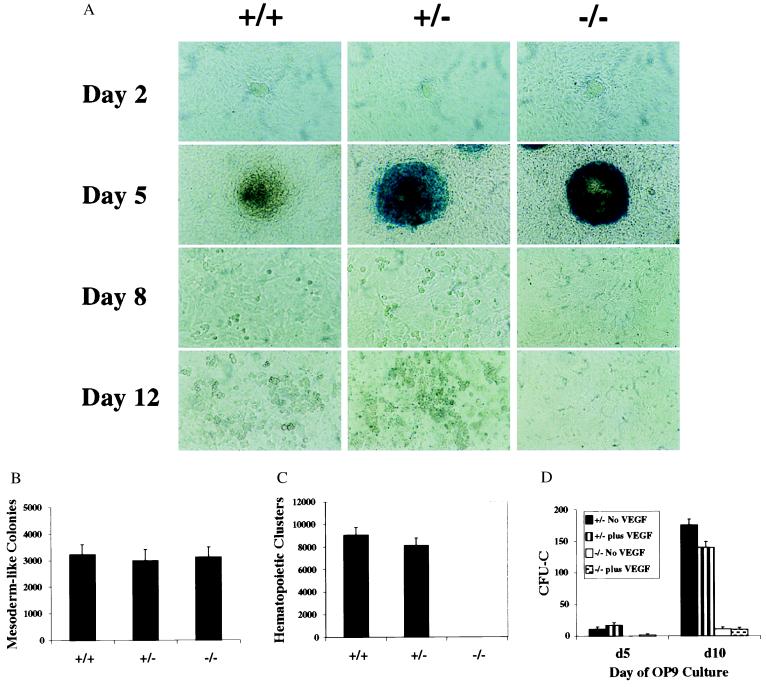
Figure 2.
Impaired hematopoiesis by flk-1-null cells in OP9 cocultures. (A) Photomicrographs of wild-type, flk-1 (+/−), and flk-1 (−/−) ES cells 2, 5, 8, and 12 days after hematopoietic induction by coculturing with OP9 cells. (×20.) Each culture was fixed with glutaraldehyde and stained for β-gal activity on the day as indicated. Undifferentiated colonies (day 2), differentiated mesodermal colonies (day 5), and hematopoietic clusters (day 8/day 12) are observed in wild-type and flk-1 (+/−) cultures. Strong β-gal expression was detected in mesodermal colonies in both flk-1 (+/−) and flk-1 −/− cultures. No hematopoietic clusters are observed in flk-1 (−/−) cultures. (B and C) The numbers of mesodermal colonies (B) and hematopoietic clusters (C) of wild-type, flk-1 (+/−), and flk-1 (−/−) ES cells on OP9 stromal cells. Mesodermal colonies and hematopoietic clusters were counted on days 5 and day 10, respectively. No hematopoietic clusters are scored from flk-1 (−/−) ES cells. (D) A time course of myeloid–erythroid colony assays of ES-OP9-derived hematopoietic progenitors. The number of CFU-Cs (the y-axis) is calculated per 5 × 10⁵ day 5 or 10 OP9 input cells. The black and vertically striped bars represent flk-1 (+/−) cultures without or with exogenously added mVEGF, respectively. The white and speckled bars represent flk-1 (−/−) cultures without or with exogenously added mVEGF, respectively. No obvious differences in colony types were apparent between flk-1 (+/−) and flk-1 (−/−) cultures.

