Figure 4.
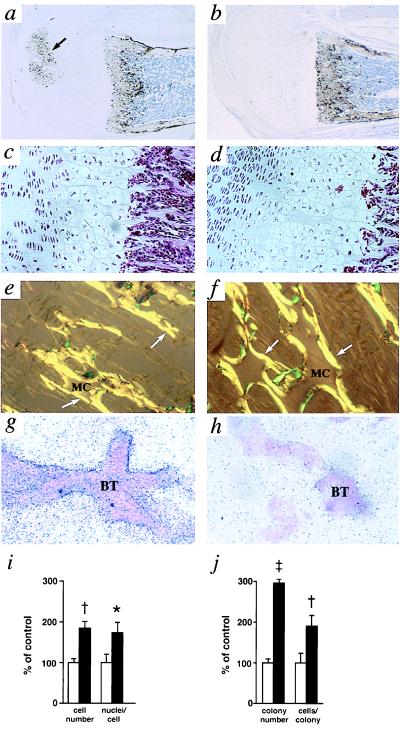
(a and b) Histochemical localization of osteoclasts by tartrate-resistant acid phosphatase staining (dark brown) in developing femurs of 10-day-old Npr3 +/+ (a) and −/− mice (b); original magnification 40×. The arrow indicates a secondary ossification center. (c and d) Cartilagenous growth plates of femurs from 10-day-old +/+ (c) and −/− (d) mice; hematoxylin and eosin stain; original magnification 200×. (e and f) Picro-Sirus Red staining of bony trabeculae in femurs from 10-day-old Npr3 +/+ (e) and −/− mice (f); original magnification 400×. The amounts of unresorbed mineralized cartilage (MC) and newly deposited bone matrix (arrows) are both increased in the mutant. (g and h) In situ hybridization for mouse NPRC mRNA in trabecular bones of 10-day-old wild-type (g) and homozygous mutant mice (h); original magnification 400×. The signal is specifically localized to the osteoblastic cells lining the bony trabeculae (BT). (i) In vitro osteoclast formation assessed by osteoclast number and by the average number of nuclei per osteoclast. Open bars, wild type; filled bars, homozygous mutant. (j) In vitro osteoblast formation assessed by number of ALP-positive colonies and the average cell number per colony in bone marrow stromal cell cultures from wild-type (open bars) and homozygous mutant mice (filled bars). ∗, P versus +/+ < 0.05; †, P versus +/+ < 0.01; ‡, P versus +/+ < 0.001.

