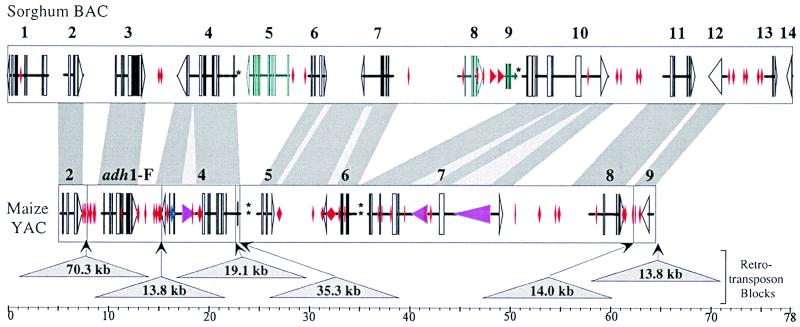
Figure 1.
Schematic representation of the structures of orthologous adh regions in maize and sorghum. The upper bar represents sorghum BAC 110K5. Putative genes are numbered by the order of their appearance on the contig, and the putative exons/introns are shown by boxes and connecting lines, respectively. The open triangles mark the end and the direction of transcription for the established cases. The red diamonds show the location and the size of MITEs and other transposon-like elements. The genes shown in blue are genes, lying among orthologous genes but missing from the maize contig. The stars reflect the location of simple repetitive DNAs. The composition of the maize region, derived from YAC 334B7, is shown below. Putative genes, exon/introns, and inserted small elements are marked as above. The purple triangles show the location, the size, and the orientation of transcription of the putative LINEs. The triangles show the location and sites of insertion of the retroelement blocks, and the numbers indicate the block sizes. The shaded regions connecting the maize and the sorghum contigs outline the regions of sequence homology between the two species. The lighter strips within correspond to stretches of interrupted homology, usually associated with insertion of small mobile elements. Both contigs are shown in scale.

