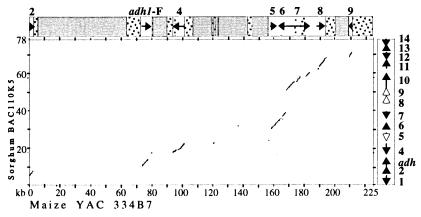
Figure 2.
dotplot homology comparisons for the colinear maize and sorghum regions. The location of the high- and middle-copy-number retroelement blocks is shown by the shaded and dotted boxes, respectively. The open boxes with the arrows show the putative maize genes identified on the contig. On the vertical line, the sorghum BAC is shown. The diagonals, reflecting homologous regions, coincide with the regions taken by genes. The sorghum genes 110K5.5, 110K5.8, and 110K5.9 missing from maize are shown by lighter arrows on the sorghum BAC.

