
Fig. 3.
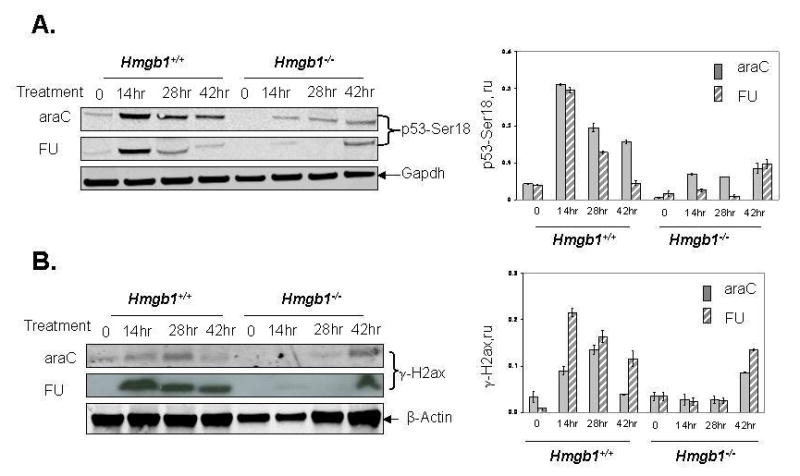
Phosphorylation of p53 and H2ax proteins in MEFs with different Hmgb1 status after araC and FU treatment. Panel A: Western blotting analysis of N-termianl phosphorylation of p53 at Ser 18 (left), and relative levels of p53 phosphorylation normalized vs GAPDH for both drugs (right). Panel B: Western blotting analysis of H2ax phosphorylation at Ser 139 after treatment with araC and FU (left), and relative levels of H2ax phosphorylation normalized vs β-actin for both drugs (right).
Cells were treated with 0.5 μM araC or 10 μM FU for 14–42 hr. Lysates from untreated cells were used as control. Data are expressed as the mean ± S.D. of three independent experiments. Bars, SD. ru, relative units. 0, no drug treatment (control).