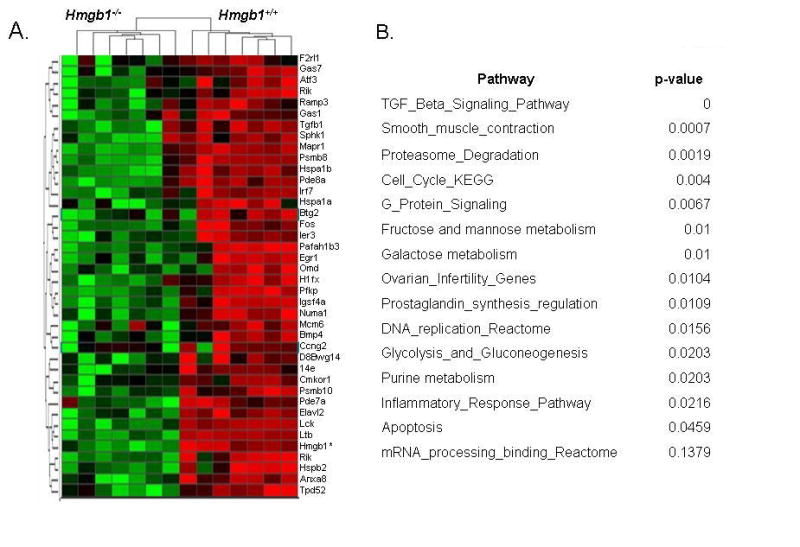
Fig. 6.

Discriminative genes differently expressed in untreated Hmgb1+/+ vs Hmgb1−/− MEFs. Panel A: Hierarchical clustering analysis of discriminative genes highly expressed in Hmgb1+/+ cells compared with Hmgb1−/− cells (red channel, overexpressed; green channel, underexpressed). Total RNA from two cell lines was extracted and hybridized with Affimetrix microarray chips in seven independent experiments; tight clusters of Hmgb1+/+ vs Hmgb1−/− cells indicate that the gene expression profiles in these two cell lines are essentially different. Supplemental Table S1 contains the complete list of discriminative genes. Panel B: Overrepresented functional categories within gene clusters regulated by Hmgb1. Pathways containing significantly differentially expressed genes in Hmgb1+/+ vs Hmgb1−/− MEFs were identified by Fisher exact test (p value <0.05).
