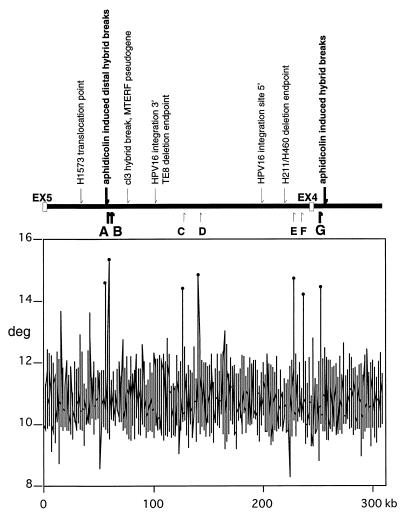
Figure 2.
Relationship between fragile-region landmarks and flexible regions. (Upper) Previously identified landmarks are indicated above the line representing the FHIT intron 4 locus. Small arrows indicate nucleotide positions of landmarks in intron 4 and intron 3. They designate sequences of a lung cancer cell line translocation point (H1573) at 26.7 kb; a spontaneous hybrid break and the MTERF pseudogene at 79 kb; HPV16 integration site endpoints at 101 and 198 kb; and a deletion endpoint of lung carcinoma cell line (H460/H211) at 222 kb. Bold arrows indicate the distal and proximal aphidicolin-induced hybrid breaks at positions 55 and 257 kb. Helix flexibility was evaluated by using a previously developed computer program (flexstab). This program measures the flexibility parameter, which is expressed as fluctuation in the twist angle. Regions of helix flexibility may be fragile points within the FRA3B, which includes introns 4 and 5. (Lower) The vertical axis shows degrees of inclination in the twist angle, and the horizontal axis indicates nucleotide position of each 100-bp window. The peak values relative to the average were considered as potential flexible regions and drawn as spikes. Positions of the seven spikes, A to G, are shown by bold and small arrows below the locus. The thick arrows representing spikes A, B, and G emphasize the observation that the aphidicolin-induced distal and proximal hybrid breaks are located close to flexibility spikes (0.35 kb from spike A and 7.1–7.6 kb from spike G, respectively).

