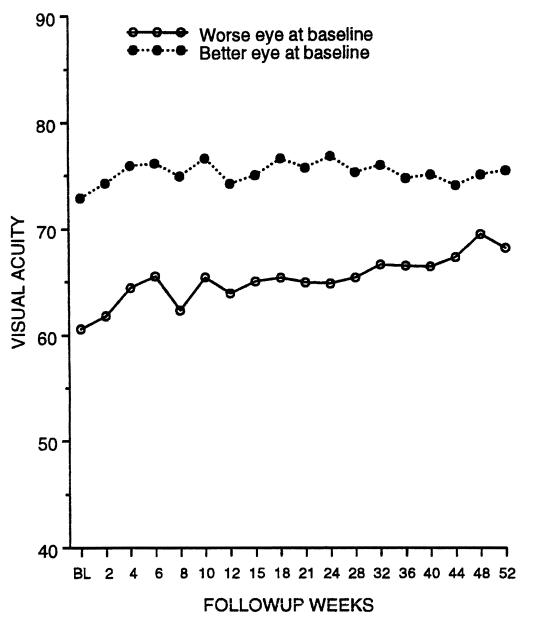
Figure 2.
The mean visual acuity of uveitis patients receiving Daclizumab therapy over a 12-month period. The two lines on the graph follow the visual acuities for the eye of each patient that had the worse visual acuity at baseline and the eye that had the better acuity. All patients in this study had two functional eyes. The BL point indicates the baseline visual acuity. The y axis indicates the number of letters read from the ETDRS chart. Therefore the greater the number of letters read, the better the visual acuity. This method of visual acuity analysis is standardized and is outlined in ref. 9. Patients reading 85 letters have an equivalent visual acuity of 20/20 in the Snellen acuity system.

